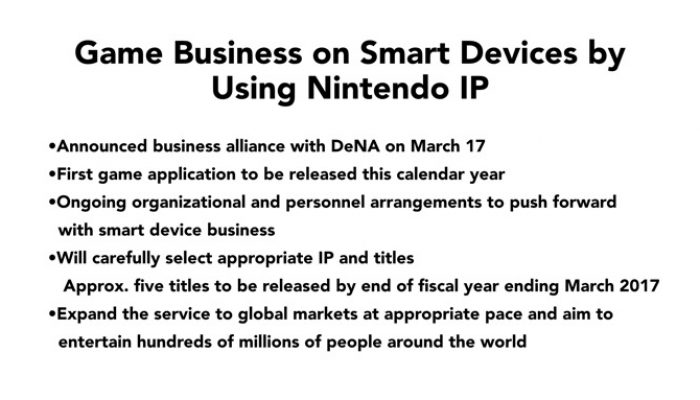
 So Nintendo makes all these expenses and preparations and yet they still have over a thousand billion yen in net assets.
☆ NintendObs Event – Nintendo FY3/2016.
Net sales
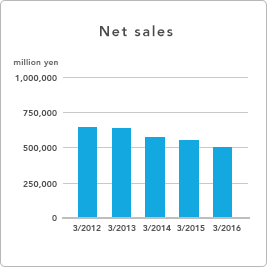
Definition of ‘Net sales’
The amount of sales generated by a company after the deduction of returns, allowances for damaged or missing goods and any discounts allowed.
Source: Investopedia.
Operating income
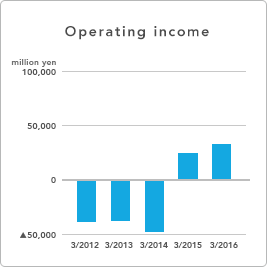
Definition of ‘Operating income’
The amount of profit realized from a business’s operations after taking out operating expenses – such as cost of goods sold (COGS) or wages – and depreciation.
Source: Investopedia.
Ordinary income
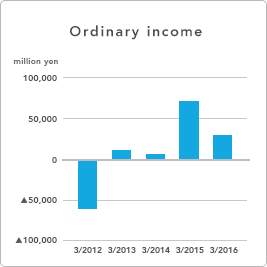
Definition of ‘Ordinary income’
Income received composed mainly of wages, salaries, commissions and interest income (as from bonds).
Source: Investopedia.
Net income
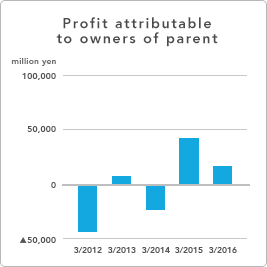
[That used to be “Net Income.” Basically these are the profits that can be redistributed to shareholders.]
Definition of ‘Net income’
A company’s total earnings (or profit).
Source: Investopedia.
Net income per share
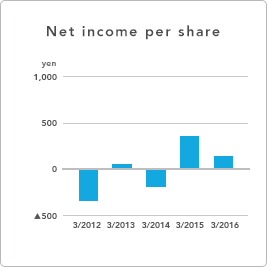
[Note]
Net income per share is calculated using the average number of outstanding shares for the fiscal year (excluding treasury shares).
Total assets
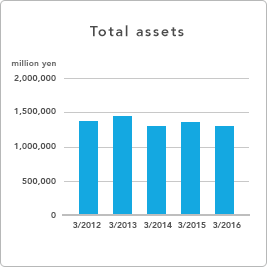
Definition of ‘Total Assets’
Total resources with economic value that a corporation owns or controls with the expectation that it will provide future benefit.
Source: Investopedia.
Total net assets
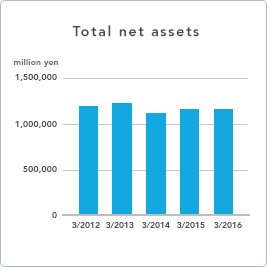
Definition of ‘Total Net Assets’
Calculated as the total assets of a company, minus any intangible assets such as goodwill, patents and trademarks, less all liabilities and the par value of preferred stock.
Source: Investopedia.
Capital adequacy ratio
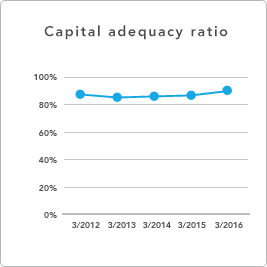
Definition of ‘Capital Adequacy Ratio’
(Total net assets / Total assets) in percentage.
Net assets per share
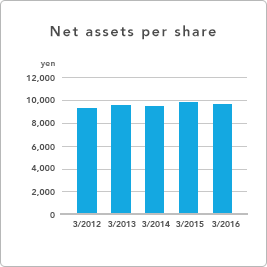
[Note]
Net assets per share is calculated using the number of outstanding shares as of the end of the fiscal year (excluding treasury shares).
Source: Nintendo JP.
At NintendObserver, the comments are on Discord.
Click on Community to learn more. 🙂
…
…Wanna play? Buy a Wii U.
And if you’ve already got yours, here are all the games already available on the platform. 😀

